
Field notes
Meta built an AI that predicts your brain
Not your thoughts. Not mind-reading. It predicts the blood-flow signal an fMRI scanner would record while you watch a video, which is a far narrower and far stranger thing. Meta open-sourced it, so I ran real ads through it, built a report where the cortical regions move in sync with the playhead, and took the architecture apart: three frozen encoders, one small transformer, and 20,484 numbers a second.
Let me put the headline in its place before it runs off. Meta's FAIR lab released TRIBE v2 this year: a model that takes a video and predicts the fMRI signal a person would produce while watching it. It was trained on people lying in scanners watching films and TV, and it outputs a predicted value for 20,484 points on the cortical surface, once per second.
That is genuinely remarkable and it is also much less than it sounds. It does not know what you are thinking. It cannot tell whether you liked something. It predicts a lagging, blurry proxy for neural activity, averaged over a person who does not exist, for a video it has never seen. Every interesting thing in this post lives in the gap between how that sentence feels and what it actually says.
It is built for neuroscience. Nothing about it was designed for advertising. I run ads for a living, so I fed it some real ones from the Meta Ad Library and built a report around the output. That part was fun. But the more interesting thing turned out to be what is under the hood, because the architecture is a clean example of a pattern worth stealing: freeze several large pretrained encoders, and train one small model to read them.
So this post is mostly the internals. What transcribes the speech, what turns pixels and waveforms into embeddings, what the trained part actually is, and how the live report is generated from the tensor that falls out.
Before any of this: what the output is not
- These are predictions, not measurements. No human watched anything in a scanner. A model guessed what a brain might do.
- The training data is films and TV, not ads. A 15-second ad with hard cuts and a call to action is a different stimulus, and I cannot tell you how much that gap distorts the output.
- "Emotion" here is anatomy, not feeling. That region pools cingulate, insula and orbitofrontal cortex, which also fire for pain, effort and plain salience.
- More predicted activity is not better advertising. There is no established path from a predicted brain response to a click or a purchase, and the model never sees your targeting, offer, price or landing page.
- It is one predicted average viewer, under a non-commercial licence (CC BY-NC).
Treat anything downstream of this as an early, exploratory look at your own footage. It is not a verdict and it should not decide whether an ad ships.
Stage 1: the video becomes timed events
TRIBE does not consume an mp4. It consumes an events dataframe, which is a long table where every row is something that happened at a known timestamp: a Video segment, an Audio segment, or a single spoken Word.
Getting there is the preprocessing pipeline. The audio is demuxed from the video, then long clips get chunked into 30 to 60 second windows. Then the speech has to be turned into words with timestamps, and this is the step people gloss over: it is not enough to know what was said, the model needs to know exactly when each word landed.
That job goes to WhisperX with Whisper large-v3. Plain Whisper gives you segment-level timings that drift by a second or more, which is useless when your target signal is sampled once per second. WhisperX runs a second forced-alignment pass over the audio, using a phoneme model to snap each word onto its true onset. The output is a TSV of words with start and end times accurate to a few tens of milliseconds.
Each word then gets annotated with its sentence and up to 1,024 tokens of preceding context, because the next stage is a language model and it needs to see the words that came before, not just the word in isolation.
Stage 2: three frozen encoders
Now the events get turned into embeddings. TRIBE runs three large pretrained models, none of which are trained or fine-tuned here. They are feature extractors, run once and cached.


Three modalities, four models. Everything except Whisper is a Meta model, which is no coincidence: TRIBE is a FAIR project built from FAIR components. Roughly 5 billion frozen parameters sit upstream of a model that trains only 177 million of its own.
A note for anyone reading the repo: the codebase also configures DINOv2-large as a fourth, static-image encoder, and I initially wrote this section with it included. Then I opened the released checkpoint. The published config sets features_to_use: ['text', 'audio', 'video'], and the checkpoint contains exactly three projectors. DINOv2 is wired up but not used by the weights you download.
It throws away the bottom half of every encoder
One design choice here is worth understanding even if you never touch the code, because it tells you what the model is actually reading.
A model like Llama processes text in layers, and the layers do different jobs. The early ones stay close to the surface: which word is this, what does it sound like. The deep ones carry meaning. And the very last one is specialised for Llama's own day job, guessing the next word, which is not a thing your brain is doing while it watches an ad.
So TRIBE reads none of the bottom half and does not lean on the final layer either. It averages across the upper layers of each encoder and feeds that in. The training run's own folder name, still sitting in the published config, is half_depth. Whatever this model is tracking, it is tracking meaning rather than surface detail, and that is a deliberate choice someone made.
Stage 3: the part that is actually trained
Everything above this point was bought, not built. Here is the only part Meta actually trained:
↓ squash each one into a shared format
↓ a transformer reads all three at once, across time
↓ a readout layer → 20,484 points on the cortex
↓ one value per second
177M trained parameters, sitting on ~5B frozen ones
That ratio is the whole idea, and it is the part worth stealing. The trained model is not learning to see, or to hear, or to parse English. Those problems were already solved by models someone else paid for. It is only learning the mapping from "rich description of a video" to "cortex", which is a much smaller problem, and one you can actually afford to train when your ground-truth data is a few dozen people in a scanner.
If you are building anything where the labelled data is scarce and expensive, that shape is available to you too.
Three quirks that change how you read the output
It is an averaged viewer, and you cannot change that. During training, each of the 25 people in the scanner got their own readout, because no two brains are laid out identically. What ships in the public model is a single averaged one. So there is no way to ask it about your customer, your segment, or your demographic. There is one predicted viewer, and they do not exist.
A silent ad still produces a reading. The model was trained with each input channel randomly switched off, so it keeps working when one goes missing. Feed it an ad with no speech and it will still draw you a full set of curves. Those curves are the model's trained behaviour with a missing channel, not a measurement of what silence does to a viewer. They look identical on screen, and that is the trap.
The five-second lag is already handled. Blood flow is slow: the signal a scanner records at second 20 reflects what the brain did around second 15. TRIBE corrects for this during training, so a peak at second 15 of the ad really is about second 15 of the ad. My report has a toggle to shift it the other way, which is a fossil from the week I had this backwards. It is off by default and it should stay off. I left it in the screenshot instead of quietly deleting it, because the thing I got wrong is more useful than the thing I got right.
Running it
After all that, the calling code is four lines. TRIBE handles the demux, the transcription and all three encoders internally.
from tribev2 import TribeModel
import numpy as np

model = TribeModel.from_pretrained("facebook/tribev2", cache_folder="./cache")

events = model.get_events_dataframe(video_path="ads/my_ad.mp4")
preds, segments = model.predict(events, verbose=False)

np.save("ads/my_ad_preds.npy", preds)
print(preds.shape) # (seconds, 20484): one row per TR, one column per vertexAlmost all of that runtime is V-JEPA encoding the video, at roughly five seconds of compute per four-second clip. Cache the .npy and never pay for it twice. My analysis script checks for the saved predictions first and only loads the 15 GB model if something genuinely needs inference, which turned an afternoon of iteration into seconds per run.
From 20,484 numbers to seven meters
The raw output is unreadable: a vertex-by-second matrix where every column is one point on a cortical mesh. To get something a human can look at, you pool vertices into named anatomical regions using the Destrieux atlas, which labels every vertex on the fsaverage5 surface with one of 75 anatomical structures. Average the vertices within a group, and you get one curve per region per second.
I used seven groups:
This is where I made the mistake I would most like you to steal from me, because it has nothing to do with brains.
To sort 20,484 points into seven buckets, I matched the anatomical names by keyword. It looked tidy. It was quietly wrong. One structure, the precuneus, contains the word that put it in my Visual bucket and the word that put it in my Default-mode bucket, so the same piece of cortex was counted twice, in two regions, on every chart I produced. Another region I wanted was never picked up at all, because I had typed its name slightly wrong and nothing matched.
So one meter was silently empty and two were double-counting. And every chart still rendered, beautifully, with plausible curves that rose and fell in convincing places. I looked at those charts for days.
The fix was to write out every name explicitly and then make the code refuse to run unless the seven groups provably had no overlap between them. Two checks, both of which would have caught this on the very first run.
The general point: if your pipeline draws you a picture no matter what you feed it, the picture is not the check. A dashboard that always renders is not evidence that the numbers behind it are real. Somebody has to write the thing that fails loudly, and it will never be the chart.
How the report cards are generated
The last stage is a build script that turns the saved predictions into a single self-contained HTML file. There is no server and no framework. The whole thing is a Python script that emits a page with the data inlined as JSON.
For each ad it collects seven curves of length T (one value per second per region), the video file, the word count, the duration from ffprobe, and a cortical map PNG. All of that is serialised into one <script> tag. A 15-ad report is a few hundred kilobytes of JSON next to the videos.
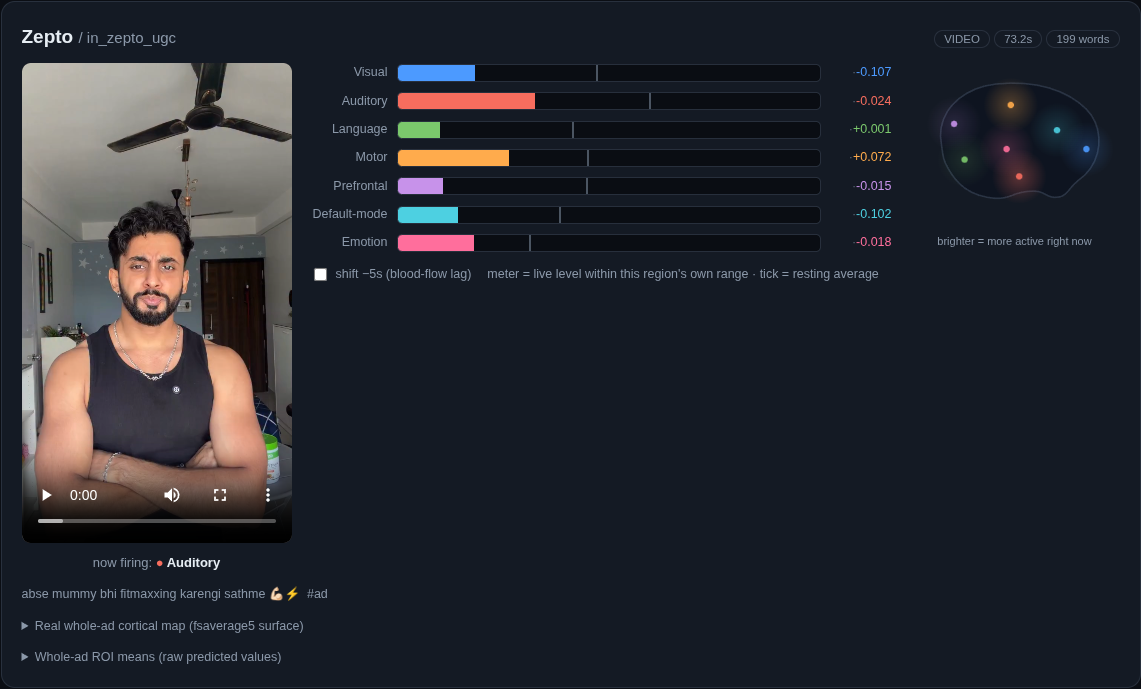
One card. The meters and the brain schematic are driven by the video's own timeupdate event, so they move with the playhead and follow you when you scrub.
The live behaviour comes from about twenty lines of JavaScript. The video element fires timeupdate a few times a second. Because the predictions are sampled at exactly 1 Hz, the index into the trace is just the rounded current time:
// per region: min, max and mean across this ad, computed once
const norm = (r, v) => (v - mn[r]) / (mx[r] - mn[r]);   // self-scaling

function frame() {
  const t = vid.currentTime + (shiftToggle.checked ? 5 : 0);
  const i = Math.max(0, Math.min(nTR - 1, Math.round(t)));  // 1 Hz => round

  for (let r = 0; r < 7; r++) {
    const v = trace[r][i];
    const f = norm(r, v);
    fills[r].style.width = (f * 100) + '%';          // the meter
    blobs[r].setAttribute('opacity', 0.05 + 0.95 * f); // the brain blob
    nums[r].textContent = v.toFixed(3);               // the raw value
  }
}
vid.addEventListener('timeupdate', frame);
vid.addEventListener('seeking',    frame);
The brain graphic is not a render. It is a hand-drawn SVG outline of a lateral cortex with seven radial-gradient circles positioned roughly where each region sits, and the JavaScript animates their opacity. It is a schematic, deliberately, because a schematic is honest about being a diagram. The real cortical surface map, rendered properly with nilearn on an inflated fsaverage5 mesh, sits behind a collapsed <details> element on each card.
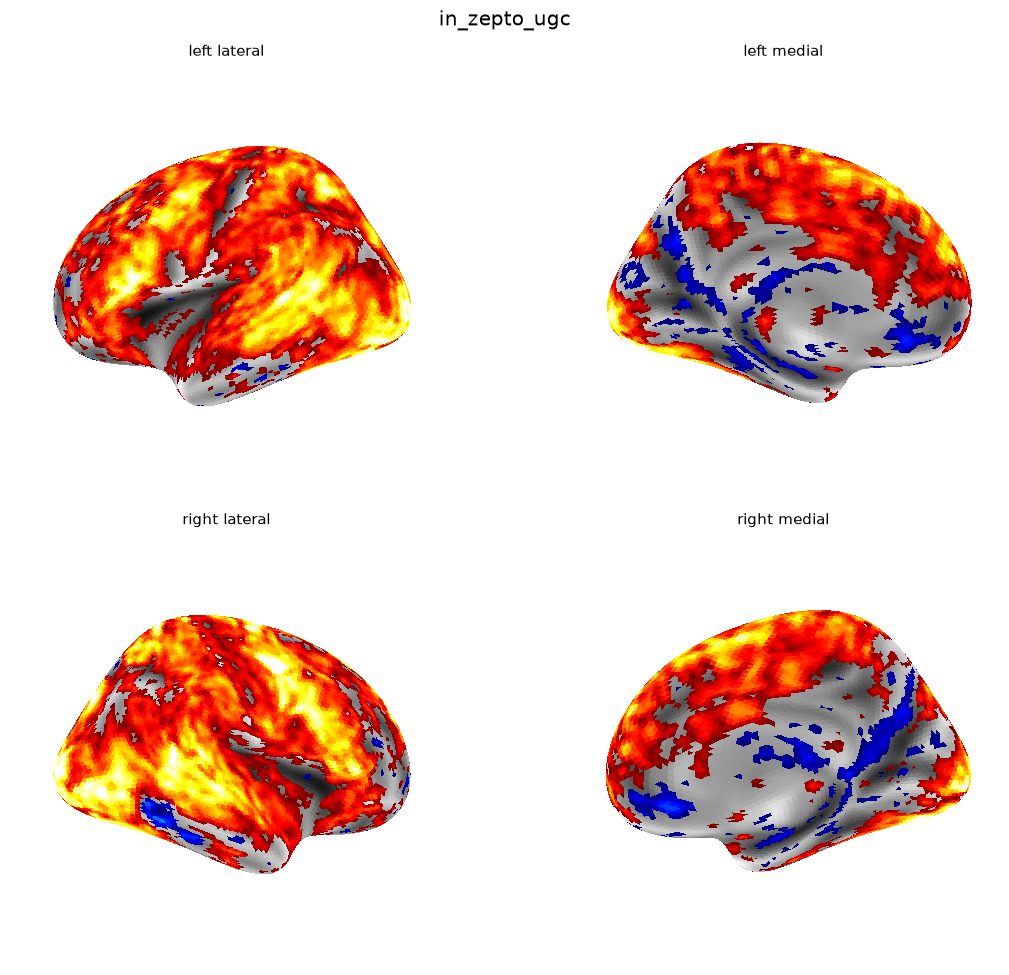
The real thing: whole-ad predicted activation on an inflated fsaverage5 surface, four views, thresholded at 15% of the 99th percentile. It is also the single easiest object in this project to over-interpret, which is why it is collapsed by default.
The meter scaling decision
This was the hardest call in the report and it is worth explaining, because it is the kind of choice that quietly turns a chart into a lie.
The predicted values have no natural unit, and this is not a vague complaint: the fMRI target the model was trained against is z-scored per sample and detrended before training. The model is predicting a standardised, drift-removed signal, so a value of +0.07 is not "seven percent of anything". It is a position in a distribution whose zero was defined by a preprocessing step.
Which leaves a presentation problem. If I scale every meter globally, the meters barely move and the report is useless. If I scale each meter to its own region's range within its own ad, they move beautifully and you can watch a region rise and fall, but bar lengths become meaningless across regions and across ads. A full Emotion bar on one ad and a full Emotion bar on another do not mean the same thing.
I chose the second, because watching the rise and fall is the entire point of a live report. Then I put the raw predicted value next to every bar, printed a resting-average tick on each track, and wrote the trade-off into the page itself, in a box you have to scroll past to reach the charts. A self-scaled meter is fine. A self-scaled meter that does not say so is a lie by presentation.
What came out
Briefly, because the point of this post is the machinery, not the marketing.
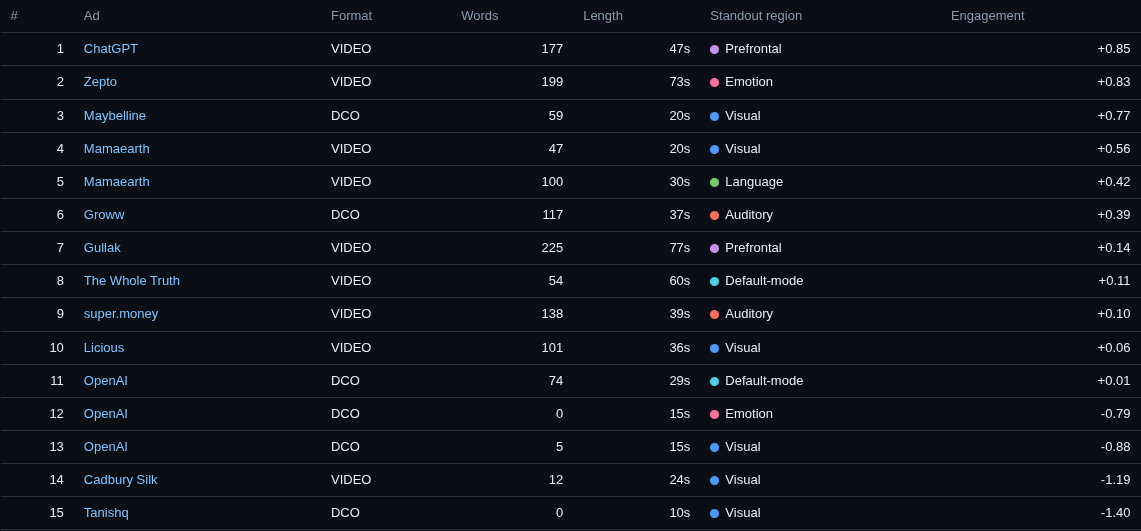
15 ads, ordered by mean z-score across the seven regions relative to the others in this set. It is a within-set comparison. Swap the fifteen ads and the ordering changes.
Ads with a lot of speech sit high. Ads with little or none sit low, and the flattest thing in the set was eleven seconds of silent B-roll. Which raises the obvious question: is that a finding about advertising, or just a language model being handed nothing to read? I lean towards the second. A silent brand film can be a very good ad, and this pipeline is close to blind to that possibility. That is a limit of the tool and not a fault in the ad.
The one result I keep turning over: three dynamic-template ads, the kind where copy is assembled from a product feed at serve time, landed at the bottom. One still had a raw {{product.brand}} placeholder in its body text. Fifteen ads is nowhere near enough to say anything firmer than "worth a look".
Where I landed
The architecture is the takeaway. Freeze the big pretrained models, read them from their upper layers rather than their last one, project each modality into a shared space, and train a modest transformer to do the mapping you actually care about. That recipe is not specific to brains. It is how you would attack any problem where your target data is scarce and expensive, which is most interesting problems.
The other takeaway is one I did not go looking for, and it generalises well past this project. Nearly everything I got wrong here, I got wrong by trusting a label instead of checking the thing. A component whose name described the opposite of what it did. An encoder wired into the repo and completely absent from the model you actually download. Brain regions I matched by name, which quietly counted the same piece of cortex twice. Every one of those produced output that looked correct, rendered a beautiful chart, and was wrong. Opening the actual model file settled all of them in about ten minutes, and I should have done it on day one.
That is not a neuroscience lesson. It is the same lesson as reading the contract instead of the summary of the contract.
The ad application is a curiosity, and I want to be plain about that. It is a way to look at your own creative from an angle you did not have before, at best a rough first-pass check on your own footage. It is not evidence, it is not a ranking to act on, and it does not know whether your ad works. That picture of a brain will make anything look rigorous, which is exactly why it needs the disclaimer stapled to it.
If you build something better on top of this, or you can show me where I have got the architecture wrong, I would genuinely rather hear that than a compliment.